Ginkgo’s Digital Biointelligence: How it Works
December 01 2023

Ginkgo Biosecurity’s Digital Surveillance Team monitors active infectious disease events of potential human consequence and scores them based on the causative pathogen, geographic scale, epidemiological characteristics, and geotemporal trends.
Identified outbreaks are assessed daily by a team of analysts and proprietary algorithms to summarize the available information and prioritize each event based on its epidemiological characteristics. This information is then displayed in an interactive dashboard allowing users to search and filter for events of interest. Monitored events of high significance are tracked at the finest geographic and spatial resolutions and are visualized on Epidemic Tracker. The Tracker presents a summary view of all currently-developing infectious disease events being monitored by Ginkgo.
The digital biointelligence data is mapped using Google’s Geocoding API system. All country and territory names appear as they are defined in that system.
All events are assigned a warning score based on event characteristics, and scores are aggregated into bins with the following guidelines for interpretation:
Score ranges and Interpretation
<4 — Lowest alert (tracking, but not yet significant)
[4—6.5) — Low alert
[6.5—8.75) — Moderate alert
[8.75—10) — High alert
>=10 — Highest alert
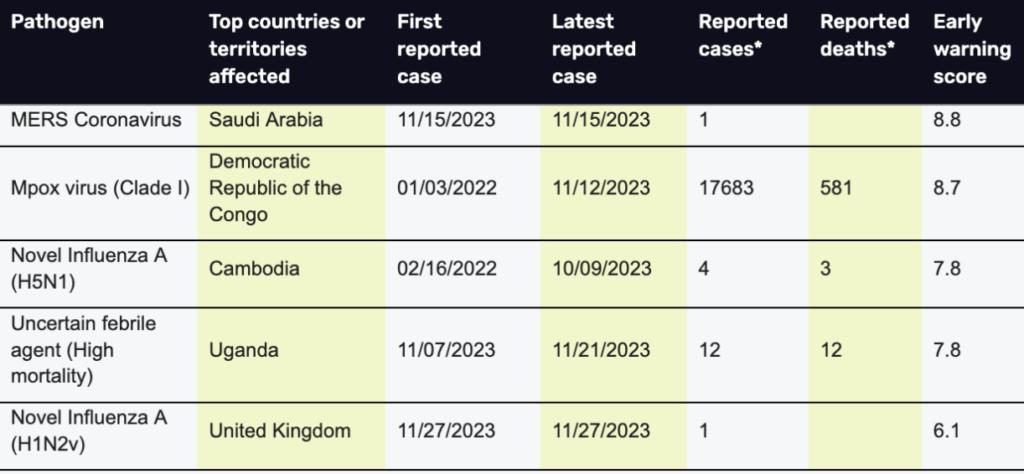
An example of this system:
A regular selection of the highest-scoring monitored outbreaks and our expert analysis are highlighted in our bi-weekly email newsletter, “On the Radar.”